Nanolive’s 3D Cell Explorer allows for the creation of very powerful 3D images and 4D time lapses of living cells with very high spatio-temporal resolution (x,y:180nm; z:400nm; t:1.7sec). Moreover, imaging with the 3D Cell Explorer does not require the use of any labels since the microscope directly measures the refractive index of the different substructures of the cell. However, in the context of molecular or cellular biology investigations, it can be useful to follow fluorescent markers combined with the refractive index distribution to validate specific structures or to correlate fluorescent signals and cellular states.
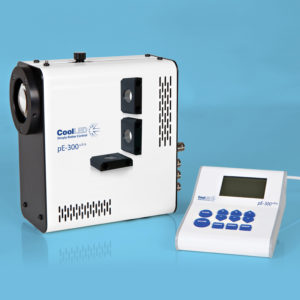
For this purpose, Nanolive developed the 3D Cell Explorer-fluo – a complete solution that combines high precision tomographic data with high quality tri- or four-channel epifluorescence provided by a CoolLED Microscope Illumination System.
In this application note we will present the time lapse imaging of mouse embryonic stem cells (mESCs) that have been genetically modified to express the fluorescence ubiquitination cell cycle
indicator (FUCCI), a two-color (red and green) indicator that allows to monitor the cell cycle phases. We will explain how to use the 3D Cell Explorer-fluo to record movies that require both fluorescence and 3D refractive index imaging and will propose a solution to analyze the resulting time lapse experiment.
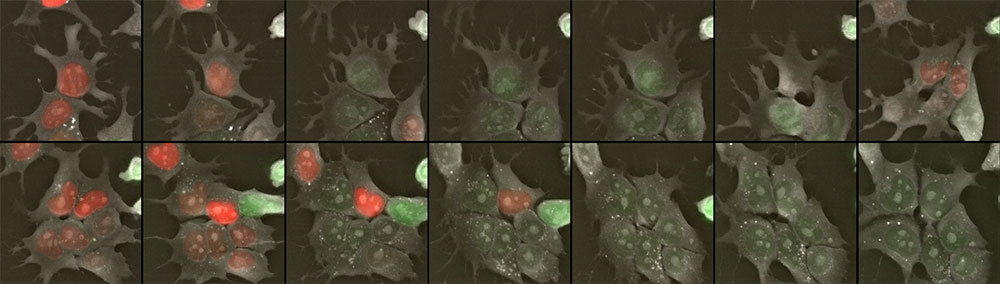
Figure 1: mESCs-FUCCI time lapse imaging. Follow this link to see the full movie: https://vimeo.com/271257958
1. Introduction
Long-term imaging of fine cellular dynamics is today’s biggest challenge in cell biology (Frechin et al., 2015; Kruse & Jülicher, 2005; Kueh, Champhekhar, Nutt, Elowitz, & Rothenberg, 2013; Skylaki, Hilsenbeck, & Schroeder, 2016). The goal is not only to acquire snapshots of dynamic biological systems, but to actually see such active processes (Muzzey, Gómez-Uribe, Mettetal, & van Oudenaarden, 2009). We mentioned in the previous application note “Growing and Filming Stem Cells with the 3D Cell Explorer” (https://nanolive.ch/wp-content/uploads/nanolive-applicationnote-stem-cells-movies-web-1.pdf) that fluorescence microscopy, while being the current method of choice in high-content live imaging approaches, induces phototoxicity when the sample is stimulated at various wavelengths. This stress induces cellular damages and limits live imaging possibilities especially with sensitive cell lines such as mammalian embryonic stem cells. Since the 3D Cell Explorer’s laser irradiates the sample with 100 times less energy than the gentlest of the current fluorescent imaging approaches, it is technically possible to perform endless live imaging of the 3D refractive index map of cells. However, advanced molecular or cellular biology investigations rely more than ever on fluorescence imaging to follow specific cellular structures, to cross-correlate fluorescent reporters or to follow cellular states or signaling dynamics via specific fluorescent reporters. In this context, offering the possibility to perform fluorescent imaging combined with 3D refractive index imaging is essential and is now possible with the 3D Cell Explorer-fluo. The combination of fluorescence imaging and label-free holotomography allows to further mitigate the phototoxic effect of fluorescence while still benefiting from its advantages, especially the possibility to follow fluorescent proteins. The alliance of these two techniques reduces the need of multiple light stimulation on the sample since holotomography provides structural and dynamic information that can, given proper correlative investigation and image analysis, replace fluorescence imaging or bridge the gap between two consecutive fluorescent acquisitions.
In this application note we will show you how to monitor mouse embryonic stem cells over their entire cell cycle by using holotomography combined with epifluorescence. We will first cover the required equipment and knowledge, then guide you through the interface of the 3D Cell Explorer-fluo. Finally, we will propose the analysis of a movie of mESCs that express the fluorescence ubiquitination cell cycle indicator (FUCCI) construct which allows to monitor the cell cycle by observing the cells in both the red and green fluorescent channels.
2. Prerequisites
First, you will need mouse Embryonic Stem Cells expressing the FUCCI construct (Sakaue-Sawano et al., 2008) (mESCs-FUCCI), growing in a glass bottom dish compatible with the 3D Cell Explorer (http://nanolive.ch/wp-content/uploads/nanolive-ibidi-labware.pdf) inside a typical cell culture incubator. The sensor FUCCI consists of two fluorescent proteins, red (RFP) and a green (GFP), fused respectively to cdt1 and geminin which are regulators of the cell cycle. In the G1 phase of the cell cycle, geminin-GFP is degraded, which leaves only cdt1-RFP expressing red fluorescence within the nuclei. In the S, G2, and M phases, cdt1-RFP is degraded and only geminin-GFP remains, resulting in cells with green fluorescent nuclei.
During the G1/S transition, cdt1-RFP decreases and geminin-GFP increases, yet, both proteins are present, therefore the nucleus appears yellow fluorescent since the green and red images are
overlaid. Thus, during the cell cycle, a cell’s nucleus will display colors from red to yellow to green before dividing when no color is observed in the nucleus anymore.
Notes:
1) This document is not about mESCs cell culture which is a research field on its own. If you wish to start a cell culture of this sort in your laboratory, please approach a specialist who will explain
the necessary dish coating and medium composition for maintaining this very specific cell type.
2) The content of this application note can be applied to any fluorescent cell line by adapting it to the specifics of the used fluorescent marker or reporters.
Secondly, you will need Nanolive’s top stage incubator equipment. This includes the top stage incubation chamber, a controller pad, and a humidity system. We recommend using our CO2 mixer and air pump that will ensure a proper control of CO2 proportions and will help you save some money on compressed air. Learn how to set up your Nanolive top stage incubator here:
http://nanolive.ch/supporting-material/. Learn how to set up a perfect environment control for mESCs here: https://nanolive.ch/wp-content/uploads/nanolive-application-note-stem-cells-movies-web-1.pdf
Finally, you will need the latest version of STEVE (Version 1.6 at least) to benefit from the latest export functionalities and image post-processing features. You will also need the software Cell Profiler
3 (http://cellprofiler.org/releases/) as well as FIJI (https://fiji.sc/#download). For data plotting and presentation, which is an entire topic on its own, we recommend a Python IDE, R or Matlab.
3. Setting up a fluorescence acquisition
As mentioned in a previous application note, the 3D Cell Explorer is capable of unmatched time lapse performances because of the absence of phototoxicity. Given proper data management
and environment control, it is possible to perform endless live imaging of fragile samples at great temporal resolution (1 image every 1.7 seconds). We will see here that having the possibility to do
holotomography and fluorescence imaging simultaneously has significant advantages, however, this implies that the phototoxicity induced by the fluorescence imaging regime needs to be managed. Once your cells of interest are in focus and ready to be imaged in the incubation chamber, click on the 4D acquisition button in STEVE. You will be asked to define the time lapse base frequency, and how the refractive index (RI) and the individual fluorescent channels should be programmed over this base frequency. The goal here is to reduce phototoxicity by reducing fluorescence acquisition frequency but to maintain a high imaging frequency with the RI acquisition.
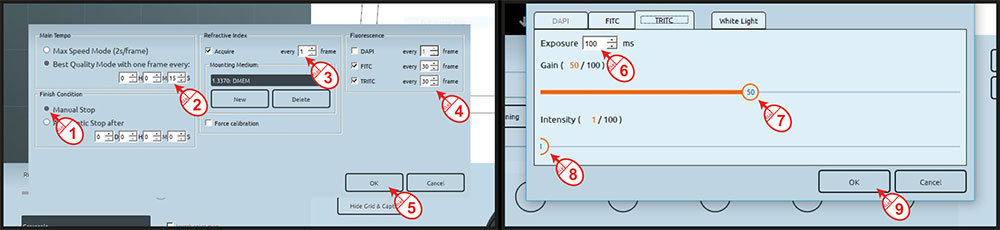
Figure 2: Set-up of fluorescence time lapse imaging
In this application note we define 15s between each image, with an RI volume acquired every 15 seconds while the green and red fluorescent channels are acquired every 30 time points i.e. every 7
minutes and 30 seconds. This is a rather challenging fluorescence imaging regime for stem cells, but since the microscope has a powerful camera and a formidable development has been made on the FUCCI construct that produces a very bright signal, we are taking advantage of these tools to reduce the light exposure to its strict minimum. Click OK, set up the green and red fluorescent channels to 100 milliseconds, 1% power and 50% of gain. Finally, define a location for your acquisition file to be stored (Figure 2).
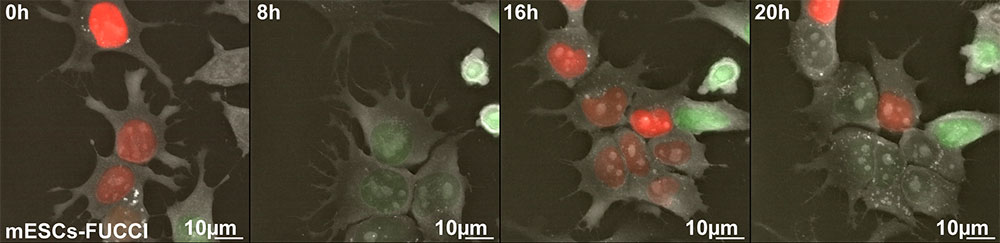
Figure 3: mESCs-FUCCI time lapse imaging
If these settings do not provide nice results and you consider to further stimulate your fluorescent dye, it is better to increase the exposure time before increasing light power in order to maintain
acute light exposure low while still increasing the stimulation of the fluorescent proteins, GFP and RFP in this case.
4. Data export
The export tool (covered extensively in the previous application note: “Growing and Filming Stem Cells with the 3D Cell Explorer” (https://nanolive.ch/wp-content/uploads/nanolive-application-notestem-cells-movies-web-1.pdf) allows to export each time point and each channel separately and to organize your dataset properly with the green and red fluorescent channels in .tif (or .png) format.
5. Creating a set of nuclei signal images Note: Here we propose one out of many image analysis solutions. What follows should serve as inspiration for your own fluorescence combined with holotomography experiment which will most likely contain very different fluorescent signals, cellular structures and dynamics. Using FIJI you can now open the red and green image sequences (File>Import>Image sequence) in two independent stacks by adding the proper name based on your image channel. Then combine the two stacks so that the green and red signals become a single additive signal that will serve for nuclei signal (Process>Calculator Plus…). Save the frames as single images using the same format as the green and red channel image sets in the same folder and with a clear file identifier.
6. Analysis of mESCs cell cycle
We will now briefly introduce you to Cell Profiler 3 and will quickly mention the image pipeline that you can build for tracking cells and extracting dynamic values from living cells in your movie.
However, Cell Profiler 3 is a wonderful tool that requires some experience and we recommend you follow their tutorial first, (http://cellprofiler.org/tutorials/) since it is not possible to cover all
necessary Cell Profiler’s details here.
We created above three sets of images: the green channel, the red channel and a sum of these two channels that will serve as the nuclear signal. Load these three sets of images and use the
nuclear signal to feed the module for primary object detection. It is then easy to obtain a nice nuclei segmentation and individual nucleus objects. If you wish, each z-slice of the RI signal of your cell can be used for detecting the cellular boundaries at a given height.
To do so, create the appropriate image sequences in separate folders (repeat paragraph 4 and 5 on the RI slices of interest), load them and use them for secondary object detection with the segmented nuclei as the seed primary object. Note that with the 3D Cell Explorer-fluo you could add a third blue or far red channel to observe a dedicated stain for the nuclei, which would ease the object detection steps. However, you would need a proper cell line expressing such markers and you would need to consider the extra amount of phototoxicity that this extra exposure would induce.
The segmented nuclei can now be tracked with the track object module as they are large and well defined. If you extract their features with the various “measure—“ modules of Cell Profiler, you can produce this type of data representation for various cell parameters. For advanced ideas on how to use the FUCCI tag please look at (Sakaue-Sawano et al., 2008).
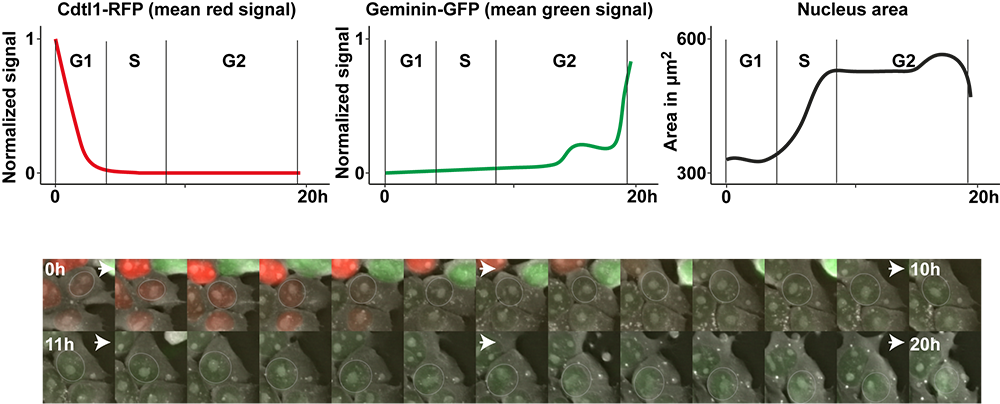
Figure 4: tracking FUCCI green and red fluorescent signals recorded with the 3D Cell Explorer-fluo
8. References
Frechin, M., Stoeger, T., Daetwyler, S., Gehin, C., Battich, N., Damm, E.-M., … Pelkmans, L. (2015). Cellintrinsic adaptation of lipid composition to local crowding drives social behaviour. Nature, 523(7558), 88–91. https://doi.org/10.1038/nature14429
Kruse, K., & Jülicher, F. (2005). Oscillations in cell biology. Current Opinion in Cell Biology, 17(1), 20–26. https://doi.org/10.1016/j.ceb.2004.12.007
Kueh, H. Y., Champhekhar, A., Nutt, S. L., Elowitz, M. B., & Rothenberg, E. V. (2013). Positive Feedback
Between PU.1 and the Cell Cycle Controls Myeloid Differentiation. Science (New York, N.Y.), 670. https://doi.org/10.1126/science.1240831
Muzzey, D., Gómez-Uribe, C. a., Mettetal, J. T., & van Oudenaarden, A. (2009). A Systems-Level Analysis of Perfect Adaptation in Yeast Osmoregulation. Cell, 138(1), 160–171. https://doi.org/10.1016/j.cell.2009.04.047
Sakaue-Sawano, A., Kurokawa, H., Morimura, T., Hanyu, A., Hama, H., Osawa, H., … Miyawaki, A. (2008).
Visualizing Spatiotemporal Dynamics of Multicellular Cell-Cycle Progression. Cell, 132(3), 487–498. https://doi.org/10.1016/j.cell.2007.12.033
Skylaki, S., Hilsenbeck, O., & Schroeder, T. (2016). Challenges in long-term imaging and quantification of single-cell dynamics. Nature Biotechnology, 34(11), 1137–1144. https://doi.org/10.1038/nbt.3713