Work smarter with the right optical filters
Optical filters can make or break a fluorescence microscopy experiment.
These are crucial components of every fluorescence microscope setup, and even have the potential to unlock breakthroughs in high-speed, high-contrast imaging offered by the latest LED microscopy illumination.
However, understanding how to select the optimum filters and deciding on a configuration can be a complex task. In this white paper, we aim to guide you through these complexities so you can make the best filter decisions for your application, and enjoy the best results.
Find out:
- How to select the right optical filters
- Which Pinkel and Sedat configurations enable high-speed imaging
- Five top tips for filters when using LED illumination

When designing a fluorescence microscopy experiment, considering the light source, optical filters and fluorophore selection in parallel is a sure step towards achieving high quality data. Many of our technical resources focus on the features and benefits of different light sources, and this white paper will instead provide guidance on selecting optical filters for widefield fluorescence microscopy.
Understanding optical filters
A standard fluorescence microscope setup often includes three components housed in a filter cube – the excitation filter, dichroic mirror (also known as a beam splitter) and emission filter, as shown below in Figure 1:

Figure 1: The anatomy of a fluorescence filter cube.
- Excitation filter – selects the wavelengths of the light from the light source to match the fluorophore’s absorbance spectrum.
- Dichroic mirror – reflects the selected excitation light towards the sample, and transmits the longer wavelengths emitted from the sample.
- Emission filter – selects only the wavelengths corresponding to the fluorophore’s emission profile, while also increasing contrast by blocking autofluorescence, stray light from the room or reflected LED light.
There are thousands of filters and dichroic mirrors to choose from, with the selection depending on the individual fluorophore(s) and light source, which is where it can become complex. The suitability of a filter is determined primarily by the wavelengths it either blocks or transmits, and an example of this can be seen in Figure 2. This shows a spectral plot of GFP, excited by a 470 nm LED and with an optimised single-band filter set.
Firstly, we can see the light source is compatible with the fluorophore, since the LED spectrum (blue) overlaps the absorption spectrum of GFP (light green). The Dichroic mirror (red) reflects light at wavelengths shorter than 495 nm, directing the excitation light path towards the sample. In the emission light path, it will instead transmit wavelengths above 495 nm towards the detector. This is ideal for GFP, since the split occurs between the peak absorption and emission, i.e. relevant excitation wavelengths for GFP are reflected towards the sample, and relevant emission wavelengths are permitted to reach the detector.
The excitation filter (purple) is tailored to transmit the relevant wavelengths from the LED required for the absorption spectrum of GFP. Note the LED ‘tail’ which extends to 525 nm: the dichroic mirror does not provide a perfect split, and some wavelengths over 495 nm would be reflected toward the sample, reflected into the emission path and contribute to background. However, this is blocked first by the excitation filter. The energy absorbed by GFP is then released as fluorescence emission (dark green). In this case, the emission filter (yellow) further blocks any light from outside the peak range of GFP emission.

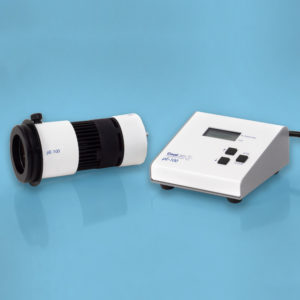
Figure 2: Optical filters and light source for GFP imaging. Single-wavelength imaging of GFP using a 470 nm LED from the CoolLED pE-100 (blue plot), exciting GFP along its excitation spectrum (light green). The excitation light path travels through the excitation filter (purple) and wavelengths below 495 nm are reflected onto the sample by the dichroic mirror (red). This energy is absorbed and released as fluorescence to form the GFP emission spectrum (dark green), and the dichroic mirror (red) transmits light above 495 nm to pass to the detector. Background noise is further removed by the emission filter (yellow) in the emission light path.
Multiplex fluorescence: Getting clever with filter configurations
Imaging a single fluorophore is relatively simple, requiring a single filter cube (Figure 1) housed in the microscope. On the other hand, capturing multiple fluorophores in a single experiment requires extra consideration to balance speed, contrast and budget.
Single-band filters – Multiple single-band filter cubes (such as that shown in Figure 1) can be housed in a motorised microscope filter cube turret for high-contrast imaging, since each cube contains filter sets specific to each fluorophore. However, switching between cubes is slow, limiting dynamic observations of multi-labelled samples to the order of seconds.
Multi-band filters – To enable simultaneous imaging of multiple fluorophores (such as in FISH applications) multi-band filters selectively transmit or block multiple wavelengths. However, full multi-band sets can lead to reduced contrast from spectral bleed-through (also known as crosstalk, where the emission from one channel is transmitted through another channel’s dichroic and emission filter). Reducing bleed-through is possible by combining single-band and multi-band filters in what are known as Pinkel and Sedat configurations.
Pinkel filters – This configuration uses single-band excitation filters with a multi-band dichroic mirror and multi-band emission filter. By taking advantage of individual channel switching of LED Illumination Systems such as the CoolLED pE-800 Series, where the single-band filters are instead housed in the Illumination System, in front of each LED, sequential imaging is possible at speeds under <7 µs. However, the multi-band emission filter can still risk some bleed-through and a reduction in contrast in some experiments due to the broad spectral nature of fluorophore emissions.
Sedat filters – To avoid any risk of bleed-through, a Sedat filter configuration uses a similar setup to the Pinkel, but also with single-band emission filters. To avoid the use of emission filter wheels (where movement can introduce latency and restrict imaging speeds), a clever trick is to incorporate an image splitter into the emission light path. These split the emission light path into up to four images displayed on different areas of the camera chip (or different camera in the case of a camera splitter), and house the single-band emission filters which sit in the light path. This setup combines the high contrast of a Sedat filter set with <7 µs LED switching speeds.
Filter top tips
Check your filters when upgrading: Historically, filters were designed around the irradiance peaks of mercury and metal halide lamps. When used with LED illumination systems, the poor matching of excitation filters reduces excitation light irradiance and therefore signal, which can compromise image quality and impact data interpretation. Upgrading a light source requires a rethink of optical filters, and LED-compatible filters are now available that match the spectra of LEDs and popular fluorophores.
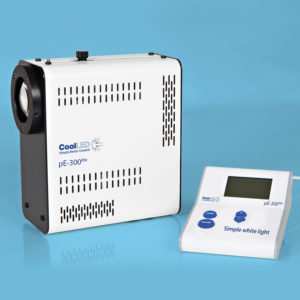
LEDs differ from lasers: Each LED has a broader spectrum compared to a laser, and unlike lasers can be tailored using optical filters to excite a broader range of fluorophores. For example, the blue LED of the CoolLED pE-300 Series can excite CFP, GFP or Ch2 if used with the appropriate excitation filters.
Utilise individual LEDs to enhance contrast: No optical filter provides a complete block to unwanted light. White light illumination will therefore result in higher background (and therefore lower contrast) when compared to utilising LED illumination technology featuring individual channel control.
LEDs require excitation filters: Even when exciting a fluorophore using only the corresponding LED, each LED spectrum has a ‘tail’ which can contribute to background noise if not blocked using an excitation filter (Figure 2).
If you have specific optical filter requirements: Filter manufacturers do not list all optical filters on their websites, and are likely to have a filter set to suit your individual requirements if you contact them to ask.
Conclusion
Optical filters require careful consideration, in terms of both choosing individual sets and configurations. This depends on the aims of each application – for example, speed is a priority for ratiometric live cell analysis, while maximising contrast is crucial for FRET. When it comes to choosing the individual filter sets, the good news is that many online resources avoid the need to analyse spectral profiles of filters, instead providing recommendations based on your requirements. We recommend:
- CoolLED Filter Finder Tool: Find Semrock and Chroma filters optimised for LED illumination systems
- Chroma Spectra Viewer: Find filters and visualise filter and fluorophore spectra
- FPbase: Visualise fluorophores, filters, light sources, detectors
- Semrock SearchLight: Find filters and visualise filter and fluorophore spectra
Alternatively, please contact us if you have any questions or require support with selecting optical filters.