New method presents an industry-standard approach to evaluating intensity
The intensity of microscope illumination systems has a significant impact on the brightness and contrast of fluorescence microscopy images and therefore data quality. Since LED microscopy illumination has become an established alternative to mercury and metal halide lamps, the topic of optimal illumination has been surrounded by complex, confusing and sometimes inaccurate measurements and terminology. Even the term ‘intensity’ is inaccurate, and a key issue has so far been an industry-wide lack of a standardised approach to measure illumination. We are now setting out to change this by introducing a protocol whereby microscopists can quantify the amount of light at the sample plane and therefore directly compare systems to find their ideal solution.
Find out:
• What is meant by illumination intensity and why we instead use the term irradiance
• Why quantifying irradiance is crucial for fluorescence microscopy
• Where irradiance should be measured and why
• How to accurately and precisely measure irradiance with our new method
Introduction
Fluorescence microscopy demands high illumination intensity to excite the fluorophore and still generate an emission spectra intense enough for bright images which capture a sample in great detail. LED illumination systems for fluorescence microscopy present a modern alternative to mercury and metal halide lamps, affording a range of benefits in terms of cost, functionality and the environment. The first system appeared on the market in 2006, and since then the performance of LEDs as a light source for fluorescence microscopy has been improving in leaps and bounds. Through improvements in efficiency in LED technology, intensity continues to increase.
LEDs are now recognised as a mature technology, but one topic lags behind. The industry has not yet settled on a standardised approach for measuring intensity. This has blocked microscopists from precisely comparing illumination systems and microscope configurations. Without a quantitative baseline, it is impossible to normalise performance requirements and configure system improvements.
This white paper aims to clarify the confusing terminology associated with illumination intensity. We propose correct terminology alongside an industry standard methodology for microscopists to easily quantify the intensity where they need it, at the sample plane. These meaningful data will allow direct comparison of all illumination systems and microscope configurations, enabling microscopists in all areas of science to optimise their system to suit their needs.
What is illumination intensity?
When product specifications or discussions surrounding fluorescence microscopy illumination mention illumination intensity, it is not often clear exactly what this refers to. This is especially true since there is currently no standard method of measurement. Firstly, let us clarify what is meant by the term intensity. Here we define a few key terms:
• Intensity: Power per unit area. It can refer to any kind of power (electrical, heat, light etc.) and is measured in W/m2
• Radiant intensity: Not to be confused with intensity, this measures power per unit steradian (i.e. power per unit cone angle of emission) in W/sr.
• Irradiance: The radiant power at a surface per unit area, measured in mW/mm2. This is our preferred term and eliminates any confusion between intensity and radiant intensity.
The concept of power is also often mentioned, as measured in Watts, but without considering area, power can vary greatly depending on the size of the illuminated area. Without understanding how effectively this power is focused onto a given surface area, this value is largely meaningless. To describe the amount of light reaching the sample we therefore refer to irradiance in mW/mm2.
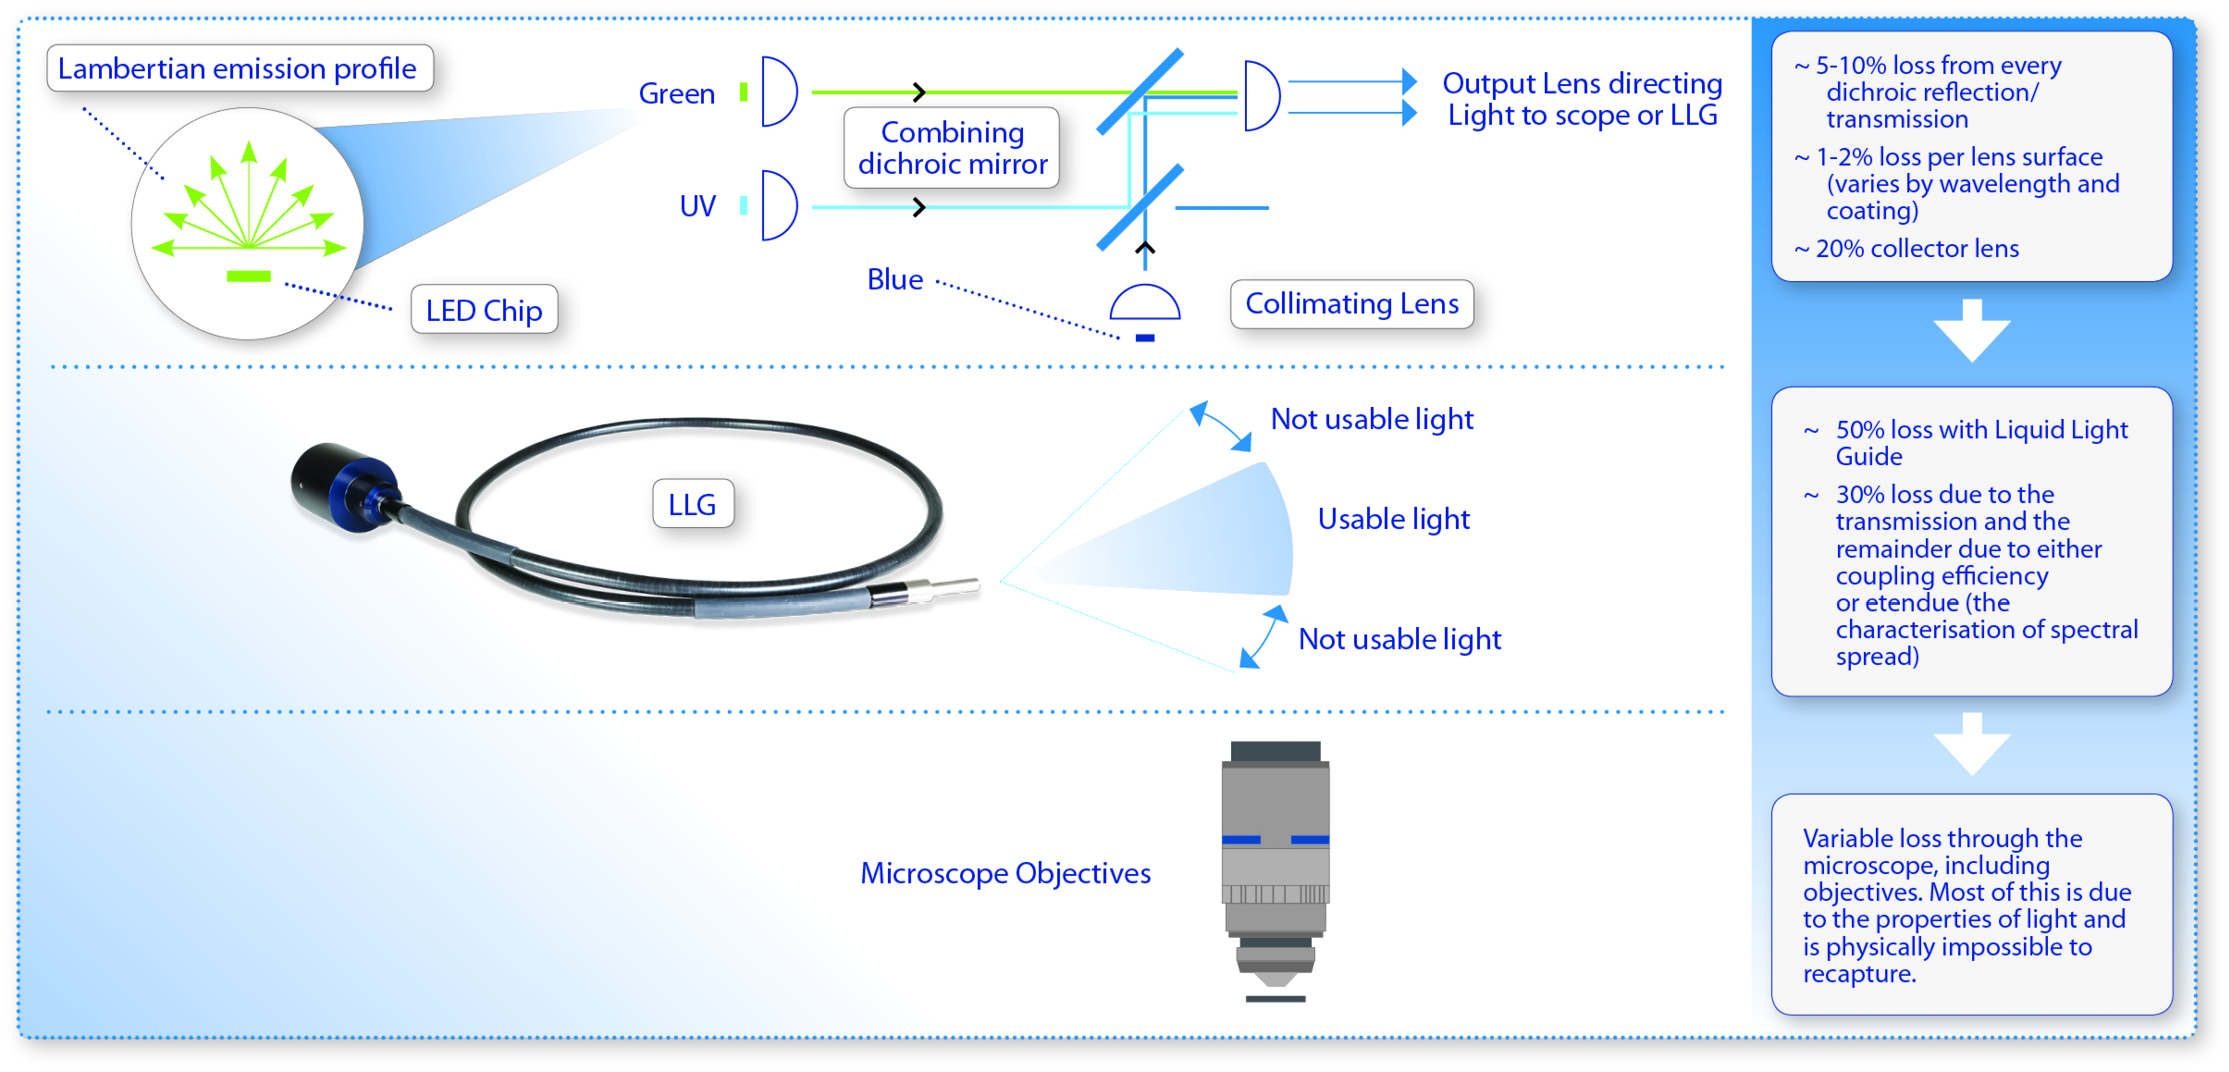
This brings us to another important consideration: where to measure irradiance. For example, some manufacturers will quote power from the LED chip, which provides the most impressive sounding statistic. However, these numbers are extremely misleading as they are not representative of the light that reaches the sample (Figure 1).
Another common method involves quoting the power from the standard 3 mm core liquid light guide with 0.58 numerical aperture. Unfortunately, this is still inaccurate, since based on the cone angle, not all light exiting the light guide may be captured at the sample plane. Quoting the power out of a fibre is likely to result in similar inaccuracies (although to a lesser degree, since fibres typically have smaller core diameters and a smaller numerical aperture). Power numbers quoted from light exiting the light source without a liquid light guide or fibre provide misleading irradiance data. Worse, the discrepancies in measuring techniques confuses any attempt to make like-for-like comparisons.
In microscopy illumination, the only significant light is the light hitting the sample to excite the fluorophore. The only meaningful place to measure the optical power of a light source is therefore at the sample plane, and we refer to irradiance measured in mW/mm2. The surface area is taken into account by quoting the objective lens used along with the field number of the camera or eyepiece in the irradiance calculations (see protocol on page 3).
Only this approach will provide accurate values, which can then be used to form a baseline for the comparison of different microscope configurations and illumination systems. Please see page three to follow the recommended protocol for measuring irradiance at the sample plane.
A protocol for measuring irradiance
At CoolLED we quote irradiance values at the sample plane of a typical fluorescence microscope, for example an Olympus BX51 microscope with a 10x (0.3 NA) or 40x (0.85 NA) objective. We would like to propose the below protocol as an industry standard.
1. Remove the excitation filter from the cube and replace the dichroic mirror with an 100% mirror. This means that we are measuring unfiltered light at the sample plane. We do this as there are many filters that may be used which can significantly affect the power. Knowing the total unfiltered power as well as the LED spectral spread allows the user to calculate the power on the sample with their chosen filters in place. Reputable filter manufacturers will provide transmission data for each of their filters.
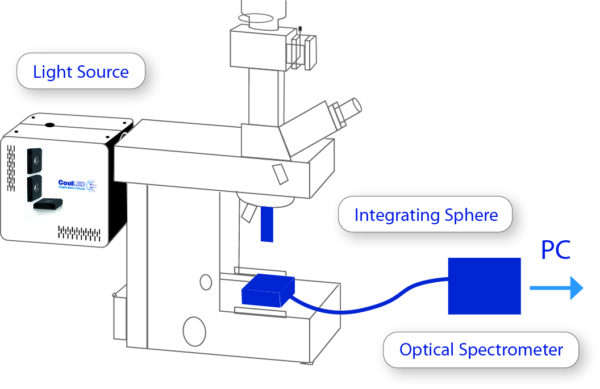
2. When measuring power at the sample plane, use a calibrated optical spectrometer. We also use an integrating sphere (Figure 2) or cosine corrector to acquire a power result that is not dependant on the ray’s angle of incidence on the detector.
3. When taking a measurement, close the microscope field stop such that the field stop image on the sample plane is just outside the field of view. This ensures that the light hitting the sample plane will only consist of light rays that are within the field of view for the given objective being used, as seen by an eyepiece or camera with a given field number. Doing this removes light that could be escaping from the objective but not making it into the field of view, achieving a more precise measurement by removing any variability caused from the field stop.
4. Once the power number has been generated from the optical spectrometer following the manufacturer’s instructions, calculate irradiance using the surface area at the sample plane.
a. Determine the diameter in mm = Field number (fn) / objective magnification (Mo).
b. Calculate surface area in mm2 using the equation πr2.
c. Use the surface area and power reading to express irradiance in mW/mm2. With good homogeneity, this value will be uniform across the sample plane.
Summary
As LED illumination technology has evolved, so has the discussion surrounding what is commonly referred to as ‘illumination intensity’. In this paper we argue that using the term irradiance is crucial to avoiding any confusion with intensity and radiant intensity. Where illumination intensity is referred to, for example in product specifications, it should be questioned as to exactly what is meant by this term.
The confusion stemming from the variety of terms and measurement techniques has created a barrier to identifying which systems truly deliver the most light to the sample plane. We now therefore strongly recommend the use of meaningful irradiance values measured at the sample plane and using the standardised protocol we have described within this document. This will equip microscopists with a way in which to compare irradiance, and boost irradiance when required.
LED power is continuing to improve and we are confident this trend will continue in the coming years. We look forward to enabling the microscopy community to independently monitor these developments with a robust and standardised approach for quantifying irradiance.
For more information on irradiance, or if you would like a product demonstration, please contact [email protected]
